Working with Flat Resolution Sky Maps
For all events, LIGO/Virgo/KAGRA also distribute the standard HEALPix
format with the file extension .fits.gz, that was the default format during
the O3 run. They are FITS image files and can be manipulated and viewed with many
commonplace FITS tools. However, they are a little unusual in two regards.
First, since they are all-sky images, they are stored in the HEALPix
[1] projection, a format that is used for Planck all-sky CMB
maps and by Aladin for hierarchical, progressively refined, all-sky survey
images (HiPS). Second, the value stored at each pixel is the probability that
the gravitational-wave source is within that pixel.
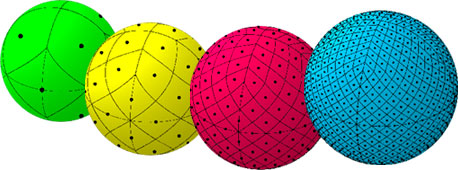
An illustration of the first four HEALPix tesselations (nside=1,
nside=2, nside=4, and nside=8). Reproduced from
https://healpix.jpl.nasa.gov.
Let’s download an example FITS file with curl:
$ curl -O https://emfollow.docs.ligo.org/userguide/_static/bayestar.fits.gz,0
We can look at the metadata inside the FITS file by printing its header with
tools like funhead from Funtools, imhead from WCSTools, or
fitsheader from Astropy:
$ fitsheader bayestar.fits.gz,0
# HDU 0 in bayestar.fits.gz,0:
SIMPLE  =                    T / conforms to FITS standard
BITPIX  =                    8 / array data type
NAXIS   =                    0 / number of array dimensions
EXTEND  =                    T

# HDU 1 in bayestar.fits.gz,0:
XTENSION= 'BINTABLE'           / binary table extension
BITPIX  =                    8 / array data type
NAXIS   =                    2 / number of array dimensions
NAXIS1  =                   32 / length of dimension 1
NAXIS2  =             50331648 / length of dimension 2
PCOUNT  =                    0 / number of group parameters
GCOUNT  =                    1 / number of groups
TFIELDS =                    4 / number of table fields
TTYPE1  = 'PROB    '
TFORM1  = 'D       '
TUNIT1  = 'pix-1   '
TTYPE2  = 'DISTMU  '
TFORM2  = 'D       '
TUNIT2  = 'Mpc     '
TTYPE3  = 'DISTSIGMA'
TFORM3  = 'D       '
TUNIT3  = 'Mpc     '
TTYPE4  = 'DISTNORM'
TFORM4  = 'D       '
TUNIT4  = 'Mpc-2   '
PIXTYPE = 'HEALPIX '           / HEALPIX pixelisation
ORDERING= 'NESTED  '           / Pixel ordering scheme: RING, NESTED, or NUNIQ
COORDSYS= 'C       '           / Ecliptic, Galactic or Celestial (equatorial)
NSIDE   =                 2048 / Resolution parameter of HEALPIX
INDXSCHM= 'IMPLICIT'           / Indexing: IMPLICIT or EXPLICIT
OBJECT  = 'MS181101ab'         / Unique identifier for this event
REFERENC= 'https://example.org/superevents/MS181101ab/view/' / URL of this event
INSTRUME= 'H1,L1,V1'           / Instruments that triggered this event
DATE-OBS= '2018-11-01T22:22:46.654437' / UTC date of the observation
MJD-OBS =    58423.93248442613 / modified Julian date of the observation
DATE    = '2018-11-01T22:34:49.000000' / UTC date of file creation
CREATOR = 'BAYESTAR'           / Program that created this file
ORIGIN  = 'LIGO/Virgo/KAGRA'         / Organization responsible for this FITS file
RUNTIME =     3.24746292643249 / Runtime in seconds of the CREATOR program
DISTMEAN=    39.76999609489013 / Posterior mean distance (Mpc)
DISTSTD =    8.308435058808886 / Posterior standard deviation of distance (Mpc)
LOGBCI  =    13.64819688928804 / Log Bayes factor: coherent vs. incoherent
LOGBSN  =    261.0250944470225 / Log Bayes factor: signal vs. noise
VCSVERS = 'ligo.skymap 0.1.8'  / Software version
VCSREV  = 'becb07110491d799b753858845b5c24c82705404' / Software revision (Git)
DATE-BLD= '2019-07-25T22:36:58' / Software build date
HISTORY
HISTORY Generated by calling the following Python function:
HISTORY ligo.skymap.bayestar.localize(event=..., waveform='o2-uberbank', f_low=3
HISTORY 0, min_inclination=0.0, max_inclination=1.5707963267948966, min_distance
HISTORY =None, max_distance=None, prior_distance_power=2, cosmology=False, mcmc=
HISTORY False, chain_dump=None, enable_snr_series=True, f_high_truncate=0.95)
HISTORY
HISTORY This was the command line that started the program:
HISTORY bayestar-localize-lvalert -N G298107 -o bayestar.multiorder.fits
There are several useful pieces of information here:
COORDSYS=C, telling you that the HEALPix projection is in the Celestial (equatorial, ICRS) frame, as all LIGO/Virgo/KAGRA probability sky maps will be.OBJECT, the unique LIGO/Virgo/KAGRA identifier for the event.REFERENC, a link to the candidate page in GraceDB.INSTRUME, a list of gravitational-wave sites that triggered on the event: H1 for LIGO Hanford, L1 for LIGO Livingston, V1 for Virgo, and K1 for KAGRA.DATE-OBS, the UTC time of the event. In the case of a compact binary coalescence candidate, this is the time that the signal from the merger passed through the geocenter.MJD-OBS, same as DATE-OBS, but given as a modified Julian day.
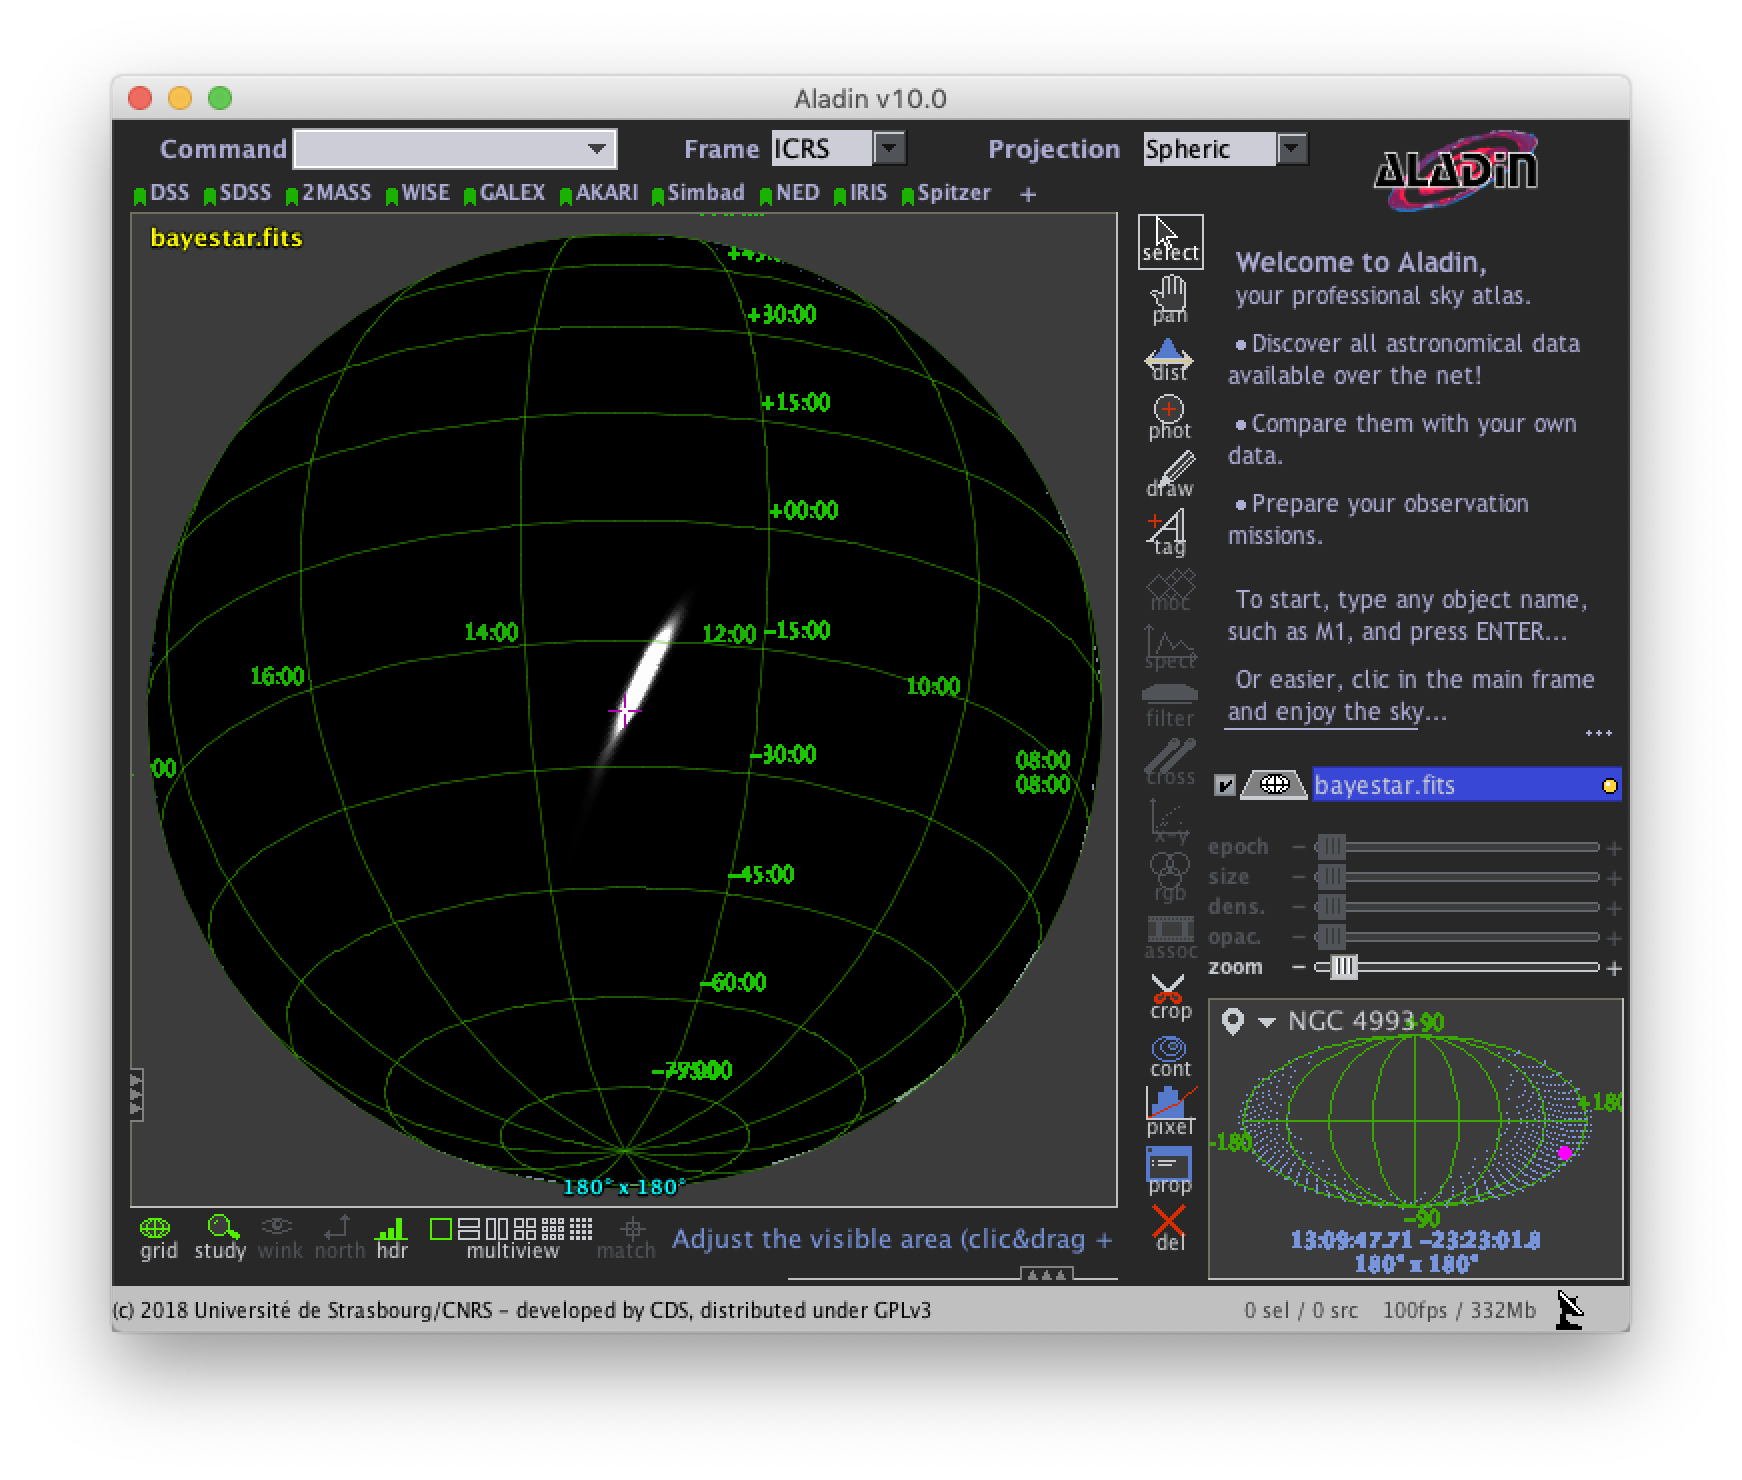
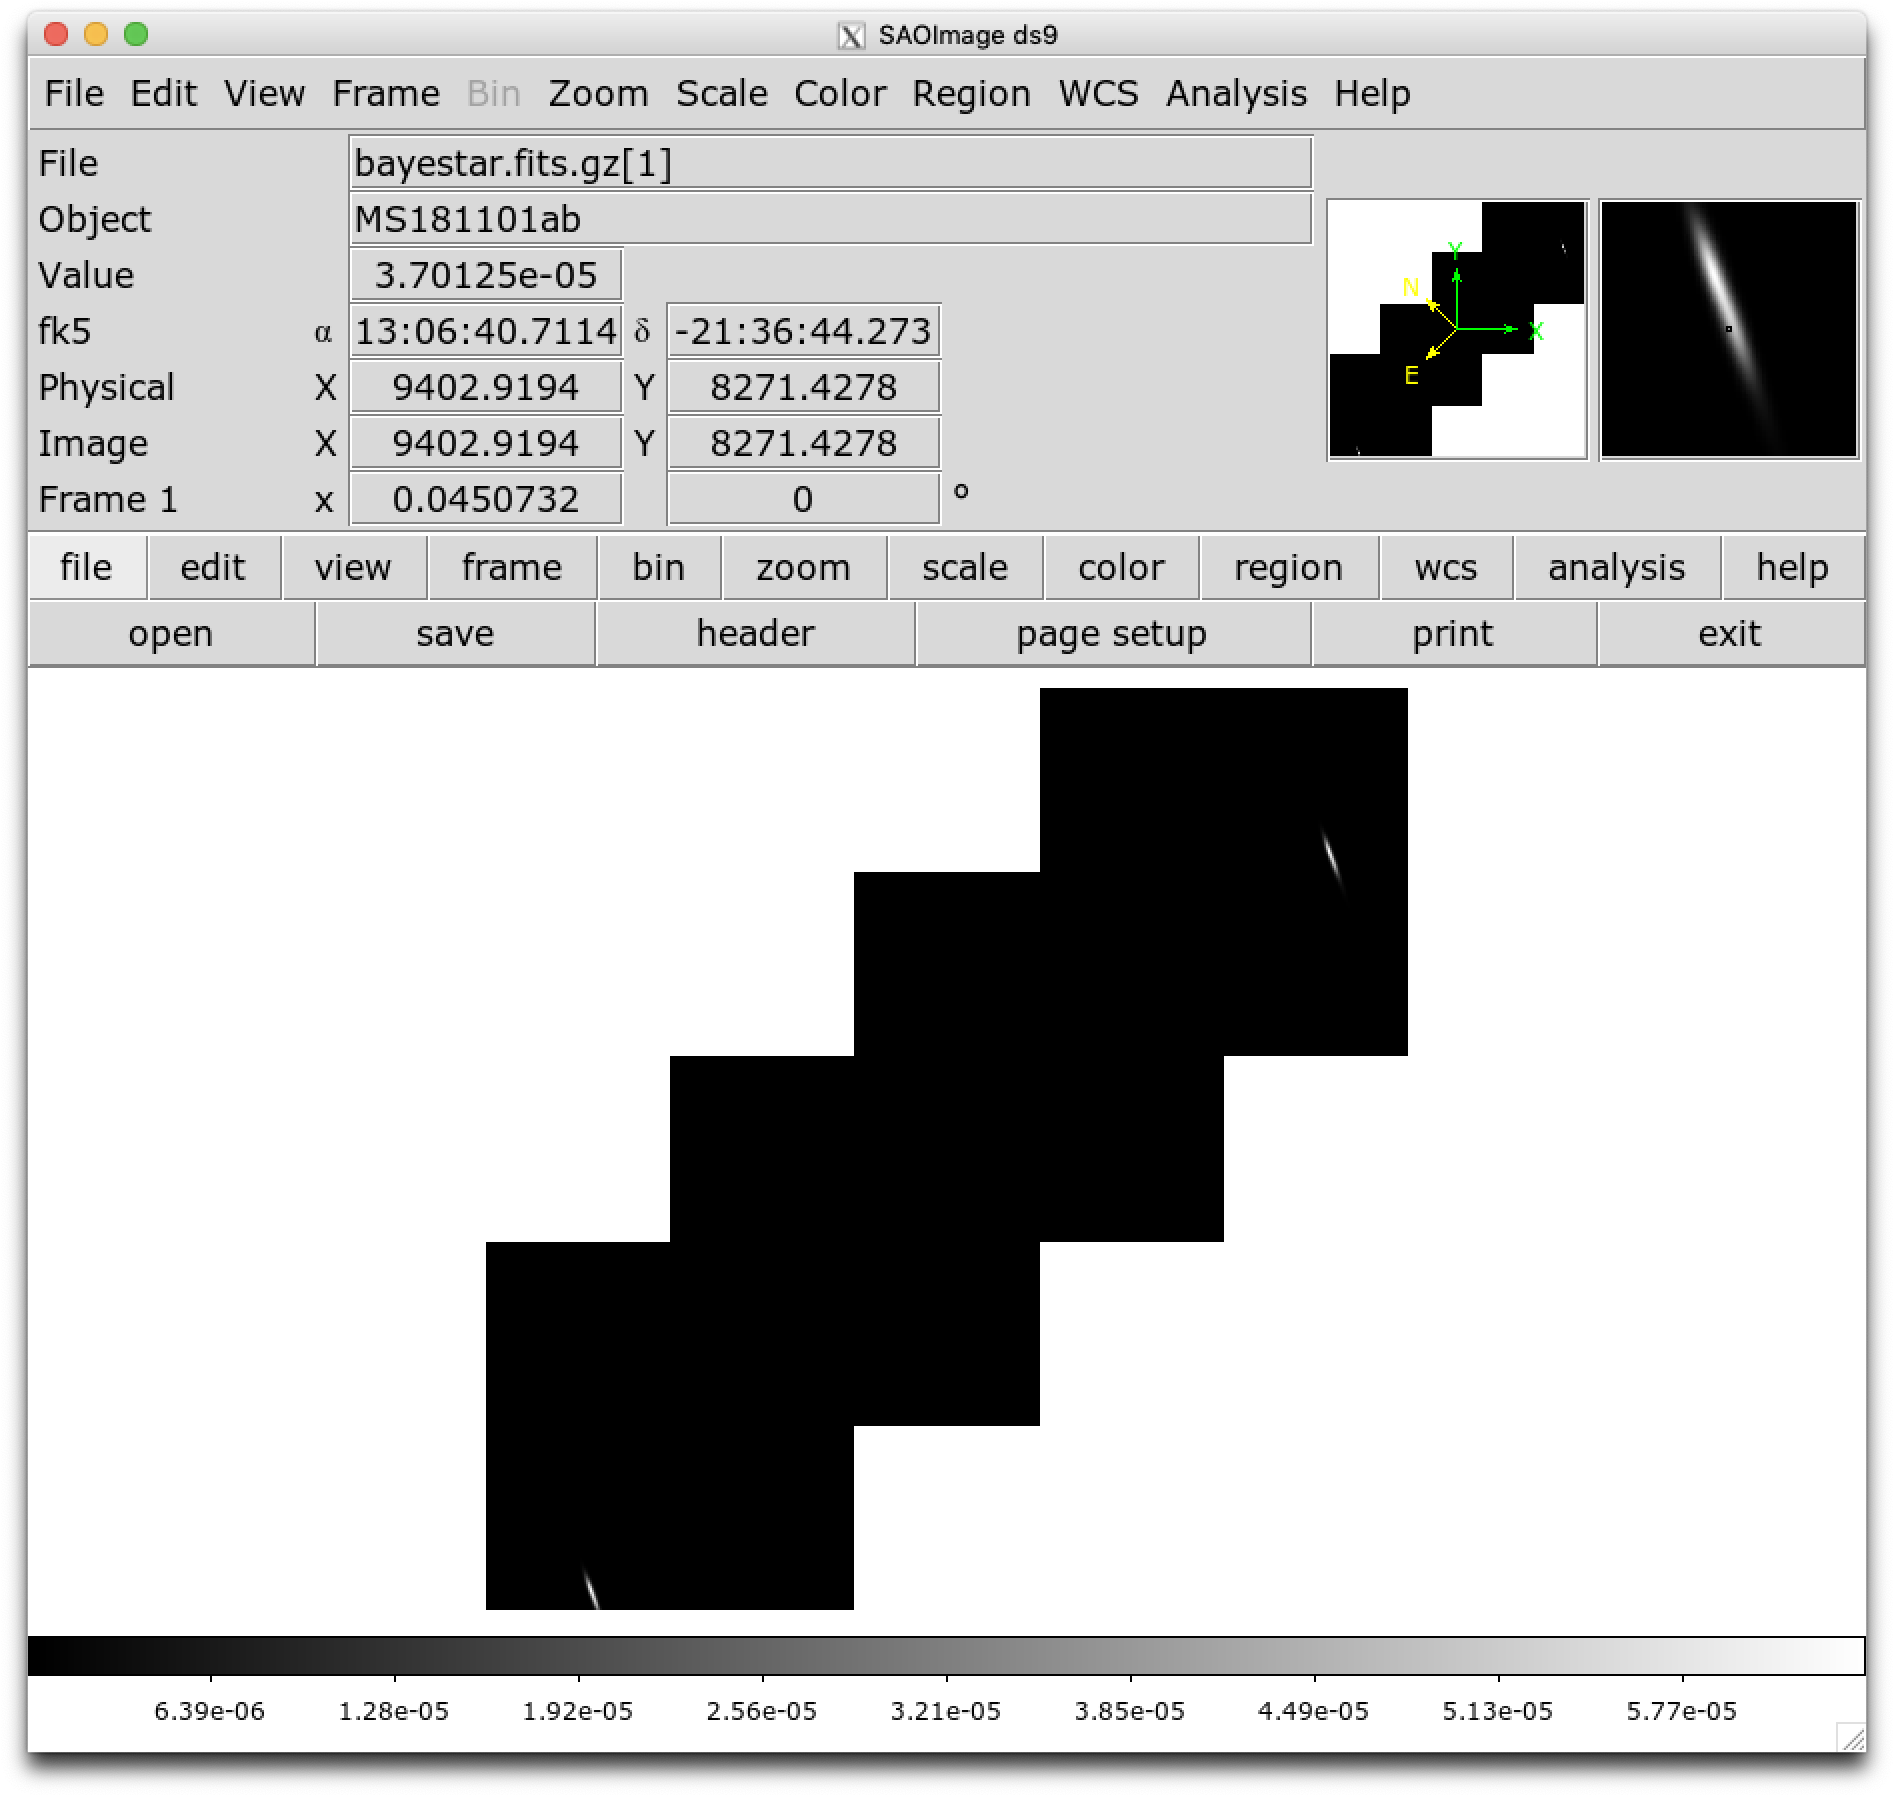
You can view the sky map in many common FITS image viewers such as Aladin:
or DS9 (although DS9 shows HEALPix sky maps in an unusual orientation; see Figure 4 of [2] for more information.
Now, let’s go through some examples of manipulating HEALPix sky maps programmatically. The HEALPix project provides official libraries for many languages, including C, C++, Fortran, IDL, and Java. However, since this is a Python tutorial, we are going to demonstrate how to manipulate HEALPix maps with the official Python library, Healpy.
Reading Sky Maps
First, if you have not already downloaded an example sky map, you can do so now by having Python call curl on the command line:
$ curl -O https://emfollow.docs.ligo.org/userguide/_static/bayestar.fits.gz,0
Next, we need to read in the file in Python with Healpy:
>>> import healpy as hp
>>> import numpy as np
>>> hpx = hp.read_map('bayestar.fits.gz,0')
You can read both the HEALPix image data and the FITS header by passing the
h=True keyword argument:
>>> hpx, header = hp.read_map('bayestar.fits.gz,0', h=True)
Manipulating HEALPix Coordinates
The image data is a 1D array of values:
>>> hpx
array([2.70726059e-66, 1.27374324e-66, 2.62611513e-67, ...,
       2.04700874e-40, 1.05781210e-35, 4.44174764e-31],
      shape=(50331648,), dtype='>f8')
Healpy has several useful plotting routines
including hp.mollview for plotting a
Mollweide-projection all-sky map:
>>> hp.mollview(hpx)

Each entry in the array represents the probability contained within a quadrilateral pixel whose position on the sky is uniquely specified by the index in the array and the array’s length. Because HEALPix pixels are equal area, we can find the number of pixels per square degree just from the length of the HEALPix array:
>>> npix = len(hpx)
>>> sky_area = 4 * 180**2 / np.pi
>>> sky_area / npix
0.0008196227004015301
The function hp.pix2ang converts from pixel
index to spherical polar coordinates; the function hp.ang2pix does the reverse.
Both hp.pix2ang and hp.ang2pix take, as their first argument, nside, the
lateral resolution of the HEALPix map. You can find nside from the length
of the image array by calling hp.npix2nside:
>>> nside = hp.npix2nside(npix)
>>> nside
2048
Let’s look up the right ascension and declination of pixel number 123. We’ll
call hp.pix2ang to get the spherical polar
coordinates np.rad2deg to convert these to right ascension and declination in degrees.
>>> ipix = 123
>>> theta, phi = hp.pix2ang(nside, ipix)
>>> ra = np.rad2deg(phi)
>>> dec = np.rad2deg(0.5 * np.pi - theta)
>>> ra, dec
(np.float64(129.375), np.float64(89.81725848475484))
Let’s find which pixel contains the point RA=194.95, Dec=27.98.
>>> ra = 194.95
>>> dec = 27.98
>>> theta = 0.5 * np.pi - np.deg2rad(dec)
>>> phi = np.deg2rad(ra)
>>> ipix = hp.ang2pix(nside, theta, phi)
>>> ipix
np.int64(13361492)
Test if a Sky Location is in the 90% Credible Region
You can easily test if a given sky position is in the 90% credible region. Let’s continue using the sky position from the previous example, for which we have already determined the pixel index.
Use the following simple algorithm to construct a map that gives the credible level of each pixel:
Sort the pixels by descending probability density.
Cumulatively sum the pixels’ probability.
Return the pixels to their original order.
In Python, you can use this simple recipe:
>>> i = np.flipud(np.argsort(hpx))
>>> sorted_credible_levels = np.cumsum(hpx[i])
>>> credible_levels = np.empty_like(sorted_credible_levels)
>>> credible_levels[i] = sorted_credible_levels
>>> credible_levels
array([1., 1., 1., ..., 1., 1., 1.], shape=(50331648,))
Note
Observe that the values in the resulting credible level map vary inversely with probability density: the most probable pixel is assigned to the credible level 0.0, and the least likely pixel is assigned the credible level 1.0.
Tip
This recipe is implemented in the package
ligo.skymap as the function
find_greedy_credible_levels():
>>> from ligo.skymap.postprocess import find_greedy_credible_levels
>>> credible_levels = find_greedy_credible_levels(hpx)
>>> credible_levels
array([1., 1., 1., ..., 1., 1., 1.], shape=(50331648,), dtype='>f8')
To check if the pixel that we identified in the previous section is within the 90% credible level, simply test if the value of the credible level map is less than or equal to 0.9 at that pixel:
>>> credible_levels[ipix]
np.float64(0.9999999999947833)
>>> credible_levels[ipix] <= 0.9
np.False_
The credible level map has a value greater than 0.9 at that sky location, therefore the sky location is outside the 90% credible region.
Find the Area of the 90% Credible Region
Since we just found the credible level map, it’s easy to compute the 90% credible area by counting the number of pixels inside the 90% credible region and multiplying by the area per pixel.
In the Python expression below, note that (credible_levels <= 0.9)
evaluates to a binary array; when it is summed over, true values are treated as
1 and false values are treated as 0.
>>> np.sum(credible_levels <= 0.9) * hp.nside2pixarea(nside, degrees=True)
np.float64(30.979279207076633)
Most Probable Sky Location
Let’s find the highest probability pixel.
>>> ipix_max = np.argmax(hpx)
What is the probability density per square degree at that position?
>>> hpx[ipix_max] / hp.nside2pixarea(nside, degrees=True)
np.float64(0.0782516470191411)
Where is the highest probability pixel on the sky? Use hp.pix2ang.
>>> theta, phi = hp.pix2ang(nside, ipix_max)
>>> ra = np.rad2deg(phi)
>>> dec = np.rad2deg(0.5 * np.pi - theta)
>>> ra, dec
(np.float64(194.30419921875), np.float64(-17.856895095545475))
Integrated Probability in a Circle
How do we find the probability that the source is contained within a circle on
the sky? First we find the pixels that are contained within the circle using
hp.query_disc. Note that this function takes as its
arguments the Cartesian coordinates of the center of the circle, and its radius
in radians. Then, we sum the values of the HEALPix image array contained at
those pixels.
First, we define the RA, Dec, and radius of circle in degrees:
>>> ra = 213.22
>>> dec = -37.45
>>> radius = 3.1
Then we convert to spherical polar coordinates and radius of circle in radians:
>>> theta = 0.5 * np.pi - np.deg2rad(dec)
>>> phi = np.deg2rad(ra)
>>> radius = np.deg2rad(radius)
Then we calculate the Cartesian coordinates of the center of circle:
>>> xyz = hp.ang2vec(theta, phi)
We call hp.query_disc, which returns an array of
the indices of the pixels that are inside the circle:
>>> ipix_disc = hp.query_disc(nside, xyz, radius)
Finally, we sum the probability in all of the matching pixels:
>>> hpx[ipix_disc].sum()
np.float64(3.655661941088471e-10)
Integrated Probability in a Polygon
Similarly, we can use the hp.query_polygon
function to look up the indices of the pixels within a polygon (defined by the
Cartesian coordinates of its vertices), and then compute the probability that
the source is inside that polygon by summing the values of the pixels.
>>> xyz = [[-0.69601758, -0.41315628, -0.58724902],
...        [-0.68590811, -0.40679797, -0.60336181],
...        [-0.69106913, -0.39820114, -0.60320752],
...        [-0.7011786 , -0.40455945, -0.58709473]]
>>> ipix_poly = hp.query_polygon(nside, xyz)
>>> hpx[ipix_poly].sum()
np.float64(1.128695302404769e-12)
These are all of the HEALPix functions from Healpy that we will need for the remainder of the this tutorial.
Other useful Healpy functions include hp.ud_grade for upsampling or downsampling a sky map and
hp.get_interp_val for performing
bilinear interpolation between pixels. See the Healpy tutorial for other useful operations.